
The "AI Will Create 40 to 60 Times More E-Waste" Claim, Examined
The Basel Action Network's projection is arithmetically defensible and widely misread. Most of the forecast tonnage is not servers.
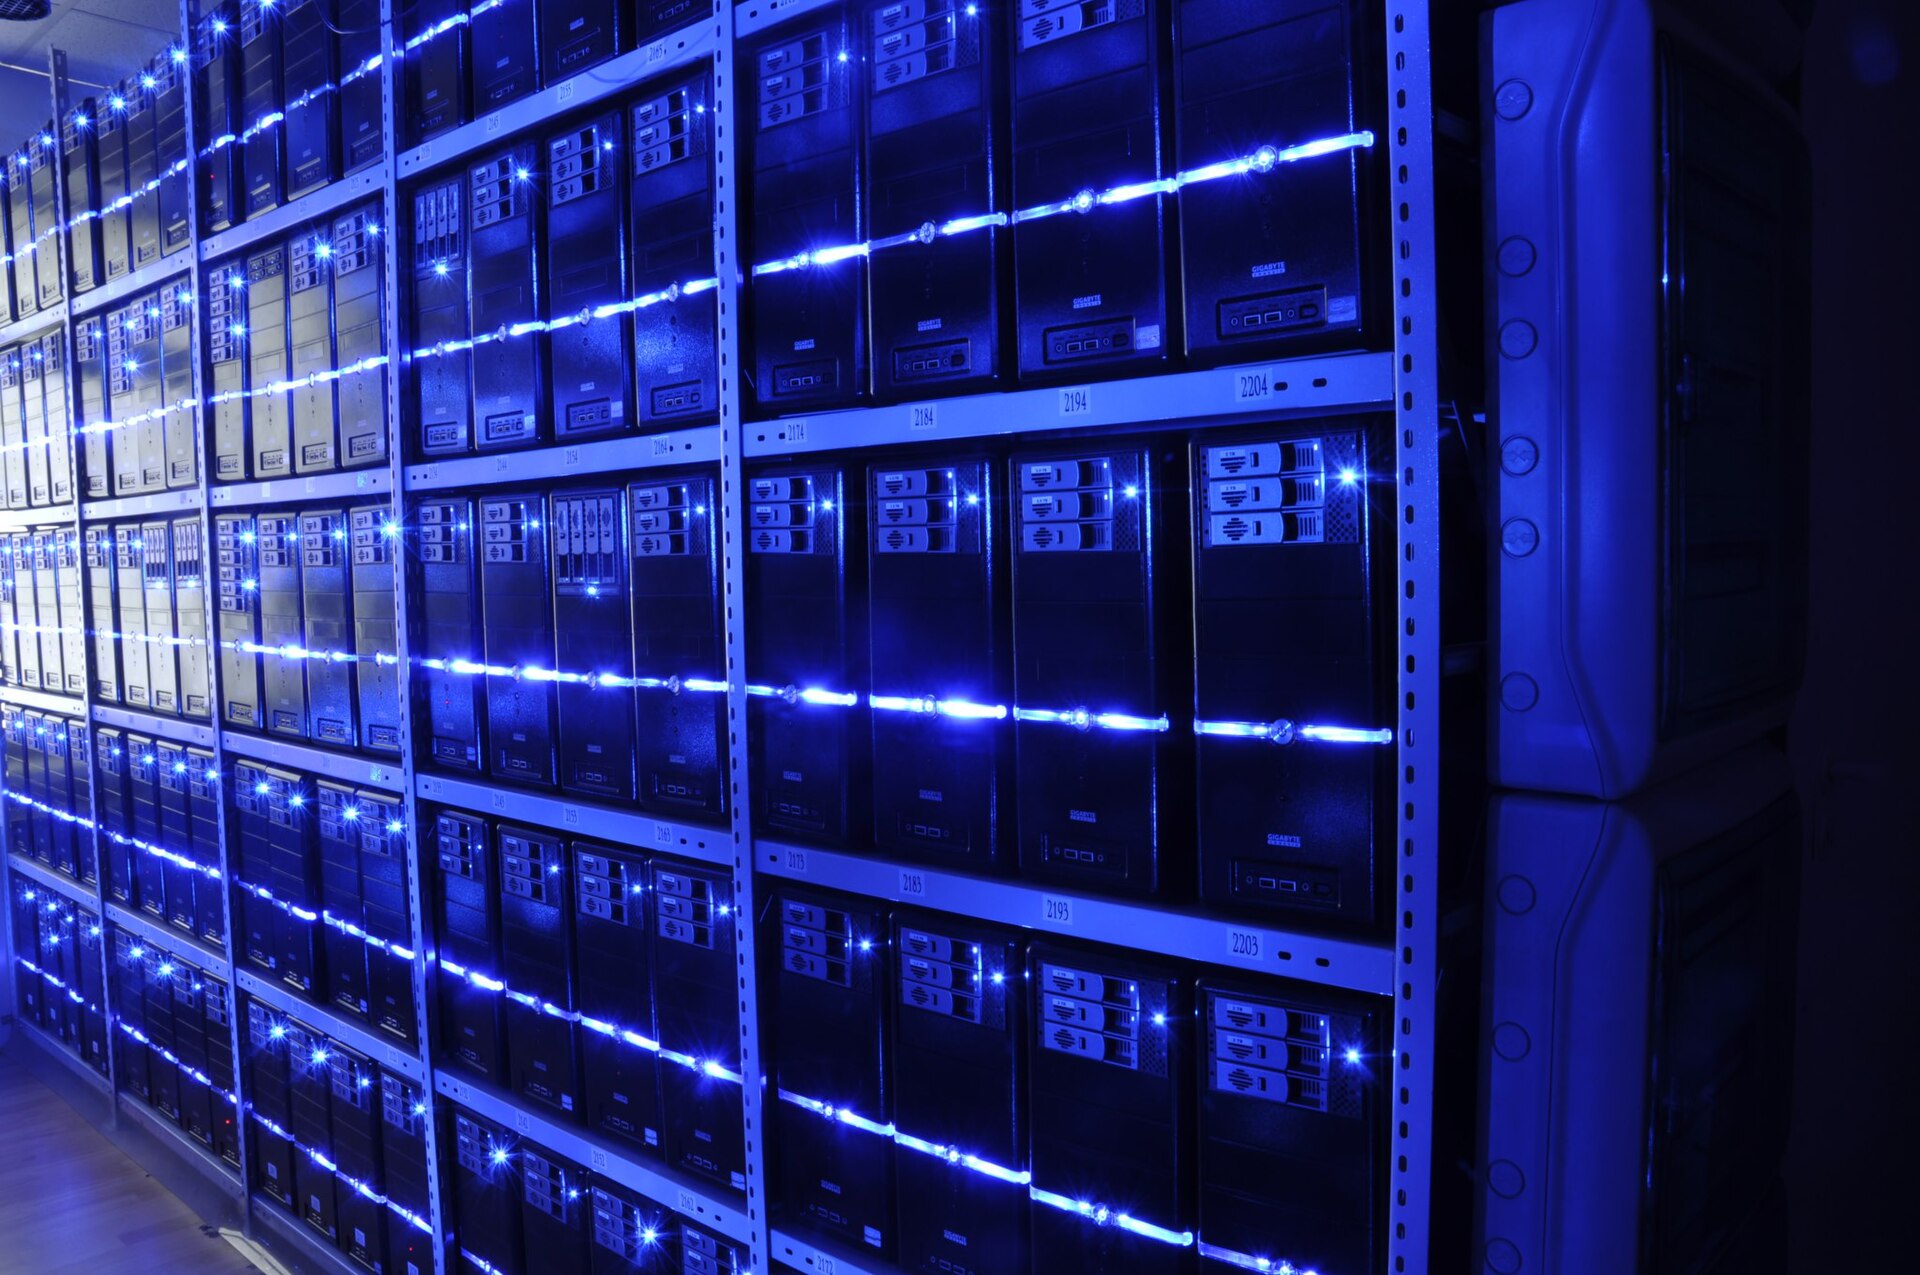
A striking number went round in 2026: AI infrastructure will generate 40 to 60 times more electronic waste than the servers themselves. The Basel Action Network puts the total at 395 to 617 million tonnes between 2025 and 2050. It is worth understanding what is actually inside that figure.
AI will produce 40-60x more e-waste than its servers.
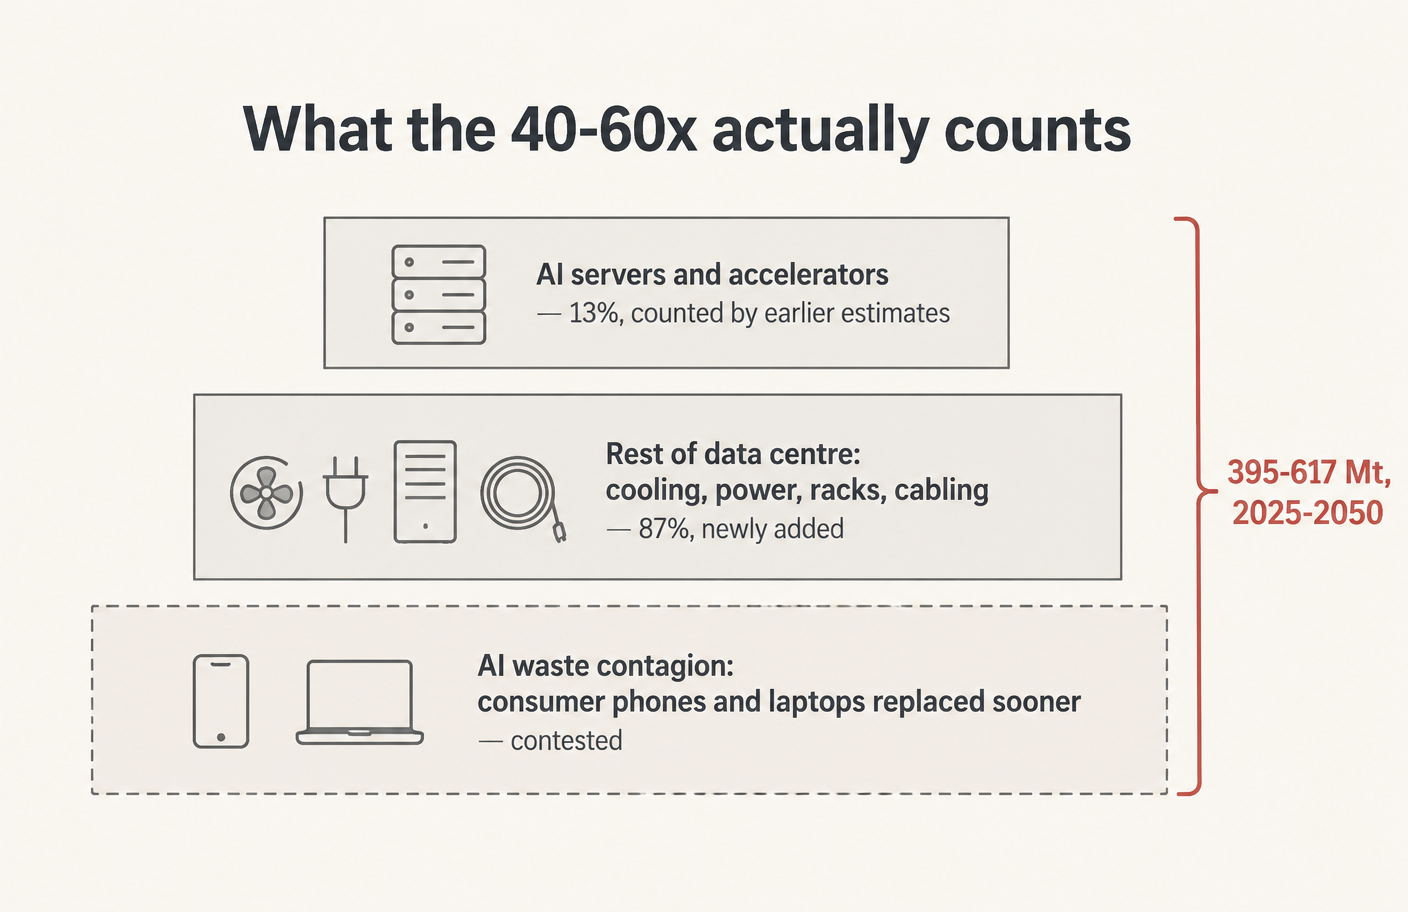
True as stated, and almost always quoted without the second half - servers are around 13% of the projected total. The other 87% is the building, the power and the cooling.
What is in the 87%
Transformers, switchgear, uninterruptible power supplies and their battery banks, chillers, CRAC units, cable, racks, network hardware, generators. This is electrical infrastructure with 10-25 year lives, and most of it is categorised as e-waste when it is replaced.
Why the framing matters
It shifts where intervention pays. Server refresh cycles are short and the hardware is dense in precious metals, so it already attracts specialist recyclers. Transformers and chillers are long-lived, heavy, low-value per tonne and handled by whoever holds the demolition contract. If 87% of the problem sits there, server take-back schemes address the smaller share.
The weak points in the projection
An unquantified reuse rate can move a waste projection by tens of percent. It is the single largest missing input here.
A 25-year forecast of a technology whose deployment rate changed completely in three years carries enormous uncertainty, which is why the range spans a factor of 1.6. Refresh intervals are assumed; they are a business decision, not a physical constant. And the projection does not appear to quantify reuse - enterprise hardware has a large and well-established secondary market, and a server sold on at year four is not waste at year four.
What is worth taking seriously
The direction, and the scope correction. Data centre build-out is real, the infrastructure component dominates by mass, and almost nobody is planning for its end of life. That is a useful finding regardless of whether the 2050 total lands at 395 or 617 million tonnes.
References and image credits›
Photo: CC BY-SA · Photo: RubinObs/NOIRLab/SLAC/NSF/DOE/AURA/J. Pinto, CC BY 4.0 · Photo: CC BY-SA