
Fewer landfills can still receive more waste
EREF’s reported trends point to consolidation, but counts, tonnage, time periods and diversion rates must not be mixed.
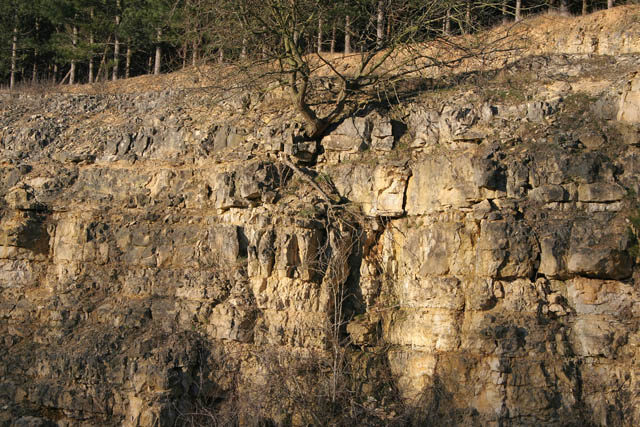
Closing disposal sites does not necessarily reduce the amount of waste buried. Remaining facilities can expand or receive material from a wider region, while transfer stations connect local collection to distant disposal.
In waste management debates, headline metrics often create an illusion of progress. A municipal authority announces the closure of an ageing county dump, or a state environmental agency publishes a declining count of active municipal solid waste (MSW) disposal facilities. To the public, a shrinking registry of disposal sites looks like evidence that source reduction, composting, and recycling are successfully starving the landfill sector of material.
The operational reality inside the waste sector is very different. Landfill closures frequently mark an economic and regulatory transition toward consolidation rather than a systemic decline in discarded tonnage. When small, unlined, or municipal-run dumps reach their permitted footprint or become too costly to monitor, their daily intake does not disappear from the waste stream. Instead, waste haulers redirect refuse to regional private mega-landfills engineered to handle thousands of tonnes per day. Tracking the true environmental footprint of solid waste requires decoupling facility counts from physical mass, understanding permitted airspace, and maintaining strict accounting integrity across different reporting timelines.
Count facilities and tonnes separately
EREF’s reported data describes increasing waste tonnage alongside fewer active landfills. These are compatible trends: a smaller number of larger facilities can handle more material. The average load per site can rise even when no new site opens.
A declining number of operating landfills indicates that municipal waste disposal is decreasing.
Landfill count measures the number of permitted operational facilities, not discarded tonnage; regional mega-landfills readily absorb volume from shuttered local sites.
The arithmetic of landfill consolidation mirrors industrial scaling seen across energy and freight logistics. Under modern environmental regulatory frameworks, such as federal Subtitle D standards in the United States, operating a disposal facility demands substantial capital expenditure. Operators must install composite composite clay and high-density polyethylene (HDPE) liner systems, leachate collection networks, leak detection monitoring wells, and sophisticated vacuum-assisted landfill gas extraction systems.
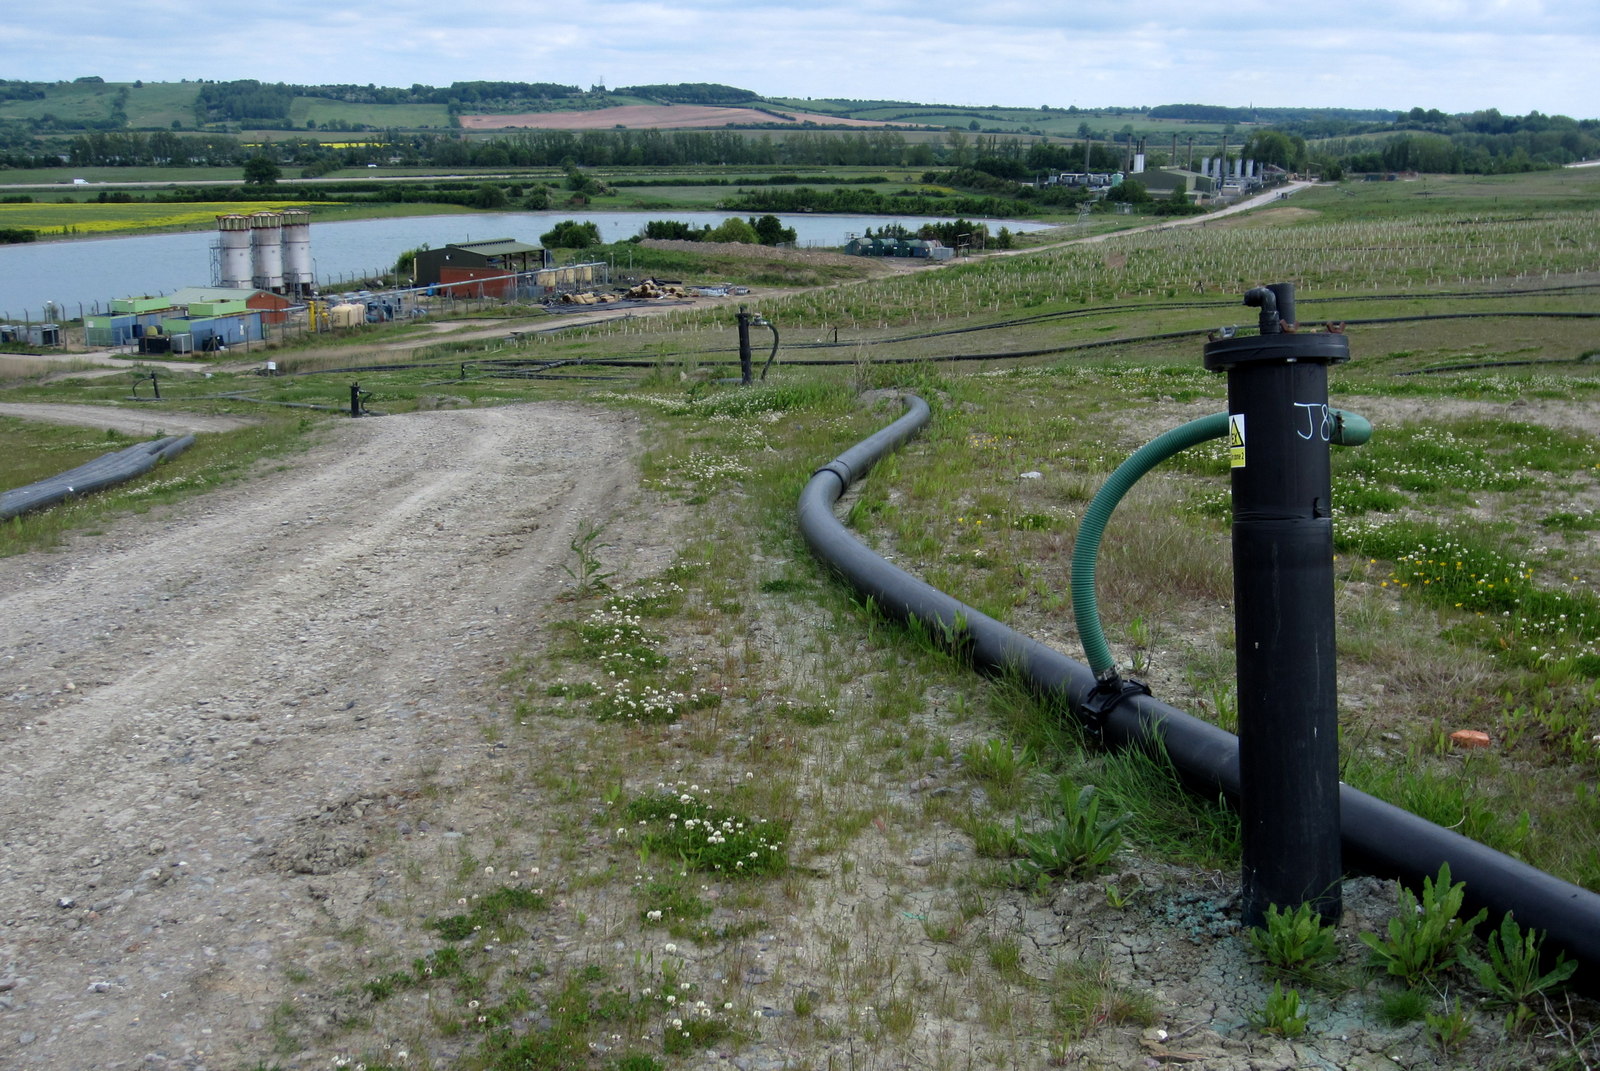
Because these baseline engineering, monitoring, and post-closure financial assurance costs are largely fixed, small landfills handling limited daily volume face punishing per-tonne economics. In contrast, large regional disposal sites dilute overhead costs across massive throughput. As local authorities decline to finance costly vertical or lateral expansions, commercial waste management corporations acquire disposal contracts and absorb the volume into regional assets.
Timing issues further compound the confusion when evaluating these industry shifts. The cited coverage also uses different time windows for tonnage, site counts and management shares. A figure ending in 2023 should not be presented as if it measured the same period as a 2025 facility count. When analysts splice a historical baseline for waste generation with a modern census of active sites, they risk fabricating an artificial correlation between declining infrastructure and throughput volumes.
How transfer infrastructure bridges the distance
Consolidation relies on an intermediary logistical link: the municipal waste transfer station. Collection packer trucks designed for stop-and-start residential routes are mechanically inefficient and economically unviable for long-distance highway hauling. Transfer stations resolve this friction by acting as regional consolidation points.
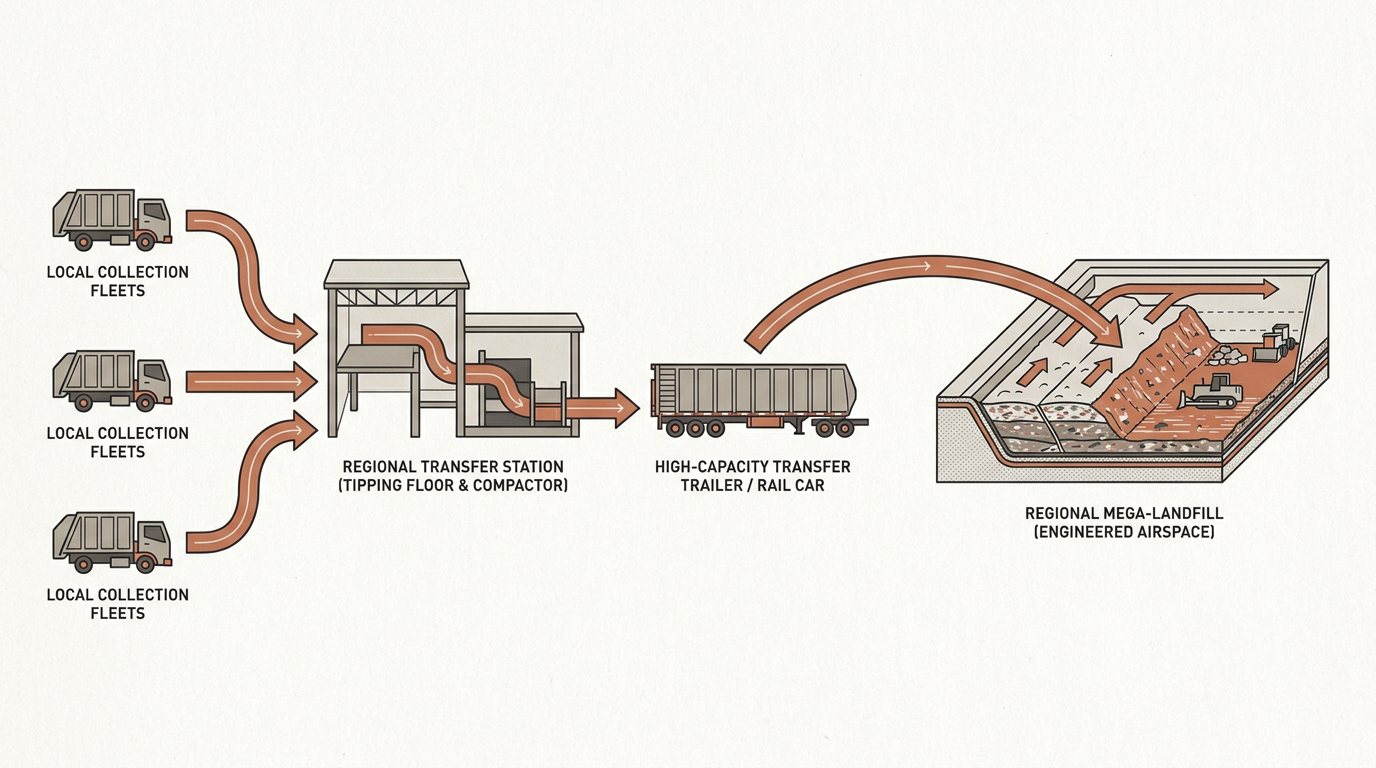
At a transfer station, local collection vehicles tip their loads onto a concrete tipping floor. Front-end loaders push the mixed waste into mechanical compactors or directly over drop-chutes into high-capacity transfer trailers or intermodal rail cars. Once payload capacities are maximised—typically around 20 to 25 tonnes per highway trailer—the consolidated waste travels dozens or hundreds of kilometres to a destination landfill. Through this transfer network, a city can shutter its local disposal site without altering consumer generation rates, municipal diversion policies, or final disposal totals by a single kilogram.
Shares require a consistent denominator
Beyond facility counts and absolute tonnages, shifting proportional shares among disposal methods can generate persistent analytical errors.
The reported landfill share rising from 67% to 71%, and waste-to-energy falling from 8% to 6%, describe the source’s waste-flow accounting. Those figures should not be combined casually with a recycling rate from another agency using a different definition or total.
Methodologies across waste research institutions vary substantially. One study may evaluate MSW strictly generated by households and light commercial businesses, while another folds in non-hazardous industrial process waste, construction and demolition debris, or municipal water treatment sludges. If one agency calculates diversion rates out of a total that includes commercial aggregate recycling while another examines only curbside post-consumer discards, comparing their proportional percentages produces meaningless conclusions.
A change in share also differs from a change in absolute tonnes. A shrinking percentage can still represent more material if the total grows sufficiently. For instance, if overall discarded waste volumes expand due to economic or population growth, an energy recovery sector experiencing a drop in its percentage share might still be incinerating roughly the same mass of material. Conversely, an expanding landfill share applied to an expanding overall generation figure demonstrates compounding growth in the absolute tonnage buried underground.
Closure is not a direct capacity measurement
Conflating the closure of a facility with an exhaustion of disposal capacity misdiagnoses how waste infrastructure is permitted and managed. Site counts do not establish remaining permitted airspace, years of life or regional access. Those require facility-level capacity and demand data. Closure decisions can reflect economics, regulation and ownership as well as a physically full landfill.
Airspace is the central unit of currency in landfill engineering. It describes the physical volume of permitted void space between the base liner system and the final permitted cap contours. A landfill operator does not necessarily stop taking waste because the physical property has run out of physical dirt. A site may close because an adjacent property acquisition fell through, because zoning boards denied a vertical elevation variance, or because updated groundwater remediation requirements made continued operations unprofitable.

Conversely, a single permitted expansion at an active regional site can inject decades of new airspace into a waste shed, offsetting the simultaneous closure of several nearby facilities. Determining regional system health therefore demands rigorous airspace consumption modeling—tracking compaction densities, daily cover ratios, and settlement rates—rather than tallying active gatehouse permits.
Regional friction and environmental burdens
Consolidation can mean longer transport routes and a greater concentration of local impacts. The practical policy question is regional: which waste streams can be prevented or diverted, which facilities have capacity and which communities carry the burden? National totals identify a trend, not a complete local answer.
When hundreds of local disposal sites consolidate into a few vast containment zones, the externalised impacts of waste management reorganise geographically. Communities hosting regional disposal complexes absorb concentrated heavy truck traffic, elevated fugitive dust, diesel particulate emissions from transfer fleets, and the long-term stewardship liabilities of massive anaerobic gas generation. While larger modern cells feature more robust containment technologies than historic dumps, they concentrate environmental risk onto fewer local hosts.
National aggregations obscure these spatial realities. A national report demonstrating steady disposal capacity can hide severe regional shortfalls, escalating tipping fees, and extended rail-haul logistics. Real progress cannot be gauged by watching the national facility count decline while tonnage continues its upward climb.
References and image credits›
Photo: Kate Jewell, CC BY-SA 2.0, via Wikimedia Commons · Photo: via Wikimedia Commons, CC BY-SA · Diagram: The Waste Stack · Photo: Nick Saltmarsh, CC BY 2.0